How to Interpret Your Car’s WLTP Fuel Consumption: A Practical Guide
Learn what the WLTP cycle really measures, why your real‑world consumption is higher, and how to use this data to compare cars fairly without being misled by marketing numbers.
Key points
WLTP fuel consumption is a standardized laboratory test that lets you compare models, but it doesn’t guarantee real‑world usage. The gap can exceed 20 % for internal combustion engines and be even larger for plug‑in hybrids, so you should adjust the figure based on your typical driving pattern.
What the WLTP Cycle Is and Why It’s the Official Reference
The WLTP (Worldwide Harmonised Light Vehicles Test Procedure) is the standardized protocol used in Europe to certify fuel consumption and emissions for light vehicles. It came into force across the EU on 1 September 2018, with Spain adopting it fully in 2021 after a moratorium. Its main goal is to replace the old NEDC cycle, which was considered overly optimistic and unrepresentative of real driving.
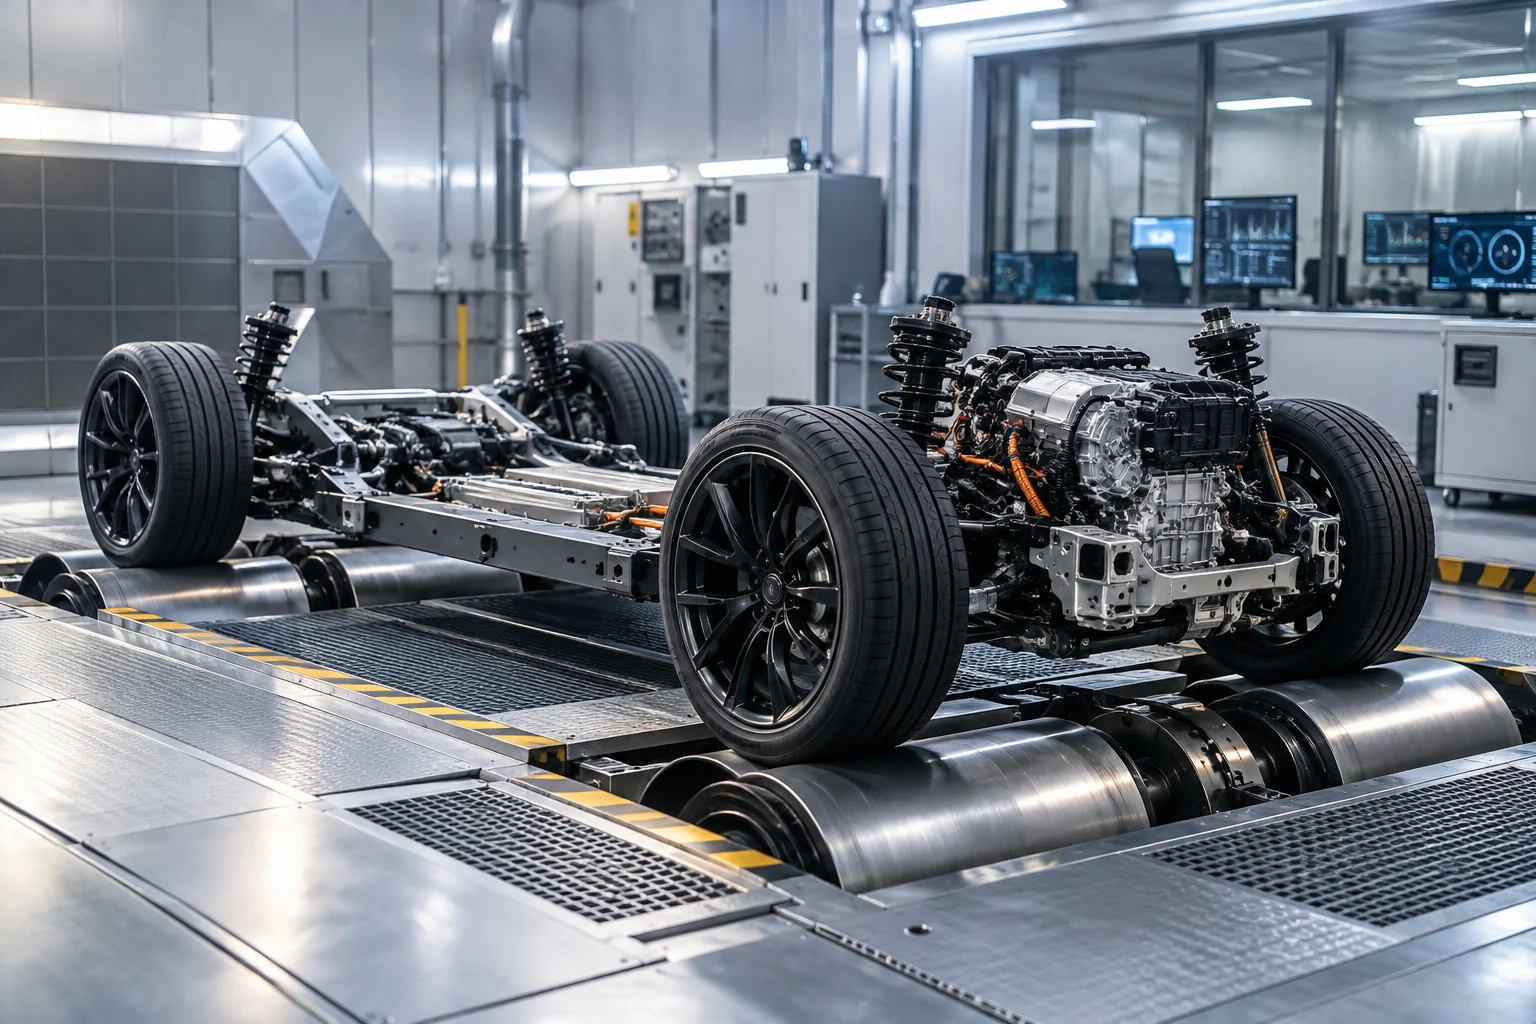
The test is carried out on a dynamometer under controlled humidity and temperature conditions to ensure all manufacturers compete on equal footing. The total duration is about 30 minutes, divided into four distinct phases: low speed, medium speed, high speed and very high speed. This standardisation allows buyers to compare models from different brands on the same metric, but it’s crucial to remember that it is a laboratory simulation, not a promise of on‑road performance.
Section references: Motorpasión: Consumo real vs WLTP ↗
- In force in the EU since 2018 (2021 in Spain).
- Replaces NEDC for being more realistic.
- Conducted on a dynamometer with controlled conditions.
Cycle Variables: Speed, Acceleration and Conditions
To understand why the official figure often differs from your experience, it’s key to know how the cycle is structured. The urban driving phase, which simulates city traffic, lasts almost 10 minutes. In contrast, the very high‑speed highway phase, with a maximum of 131 km/h, lasts just over 5 minutes. This proportion explains why many cars appear more efficient on long trips than they actually are.
Manufacturers must publish the consumption obtained in each of these four phases, along with a combined average. However, advertising and technical sheets usually highlight the combined or average figure. This number is useful for a general comparison, but it can hide a model’s weaknesses in specific scenarios. For example, a car may have excellent urban consumption but very high highway consumption, which the combined average smooths out.
Section references: Motorpasión: Consumo real vs WLTP ↗
- Urban phase: almost 10 minutes of simulation.
- Very high‑speed phase: over 5 minutes (max. 131 km/h).
- Manufacturers mainly advertise the combined consumption.
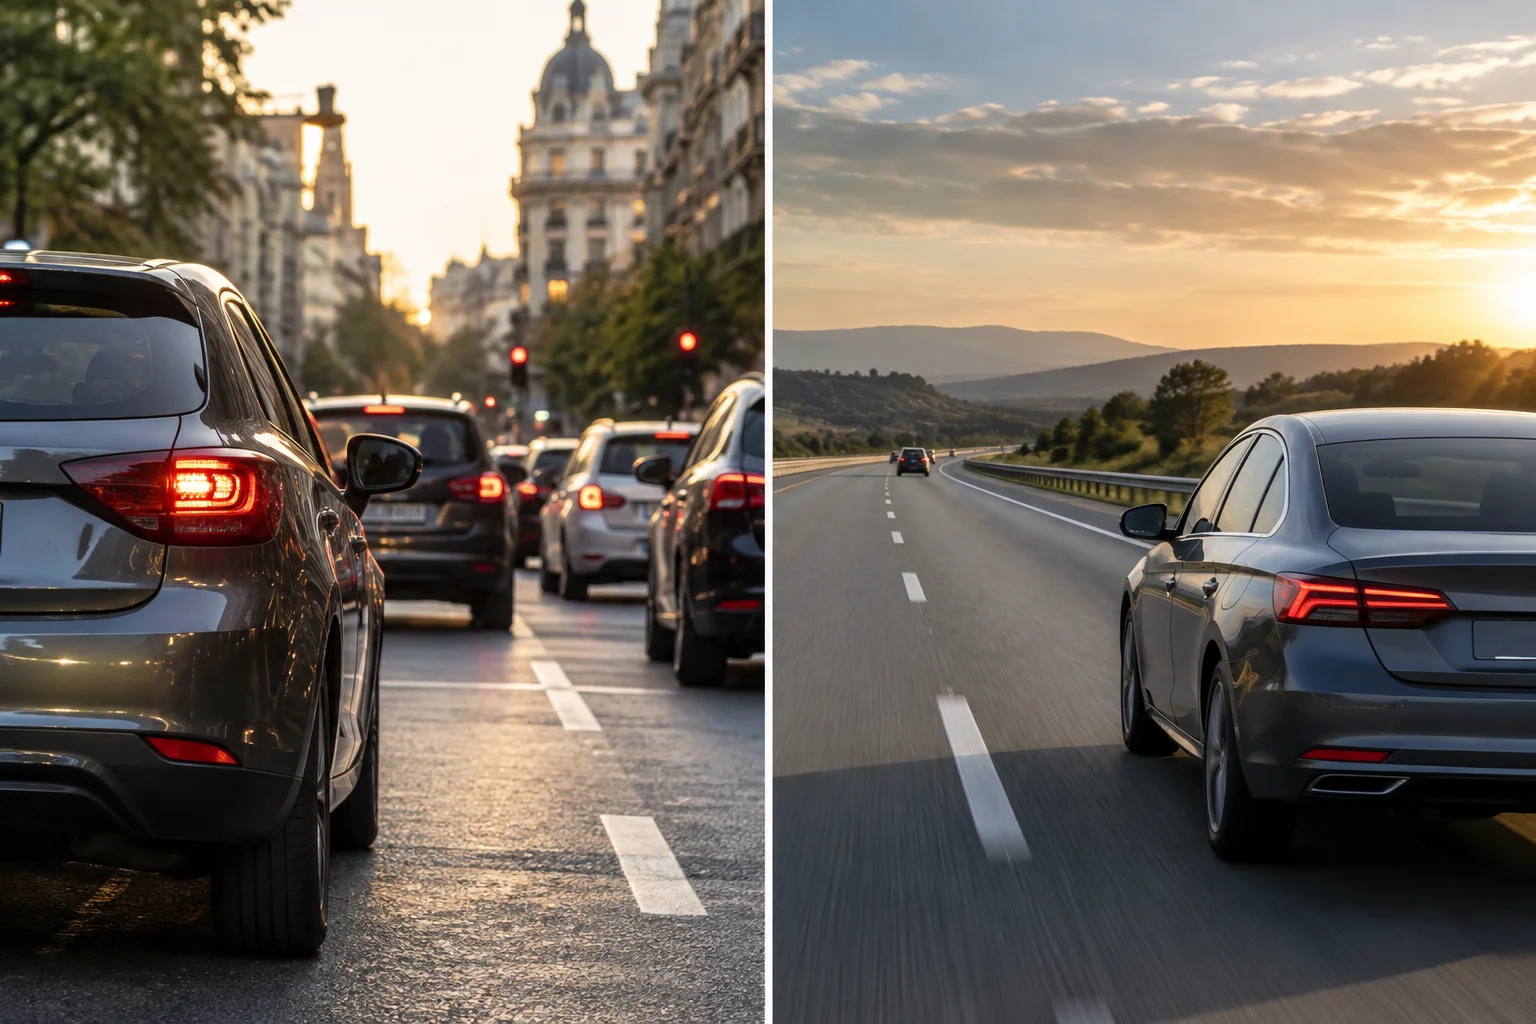
Why Real‑World Consumption Usually Differs from the WLTP Figure
The gap between laboratory and road is a documented phenomenon. An EU Commission report indicates that real fuel consumption averages 20 % higher than the WLTP figures reported by manufacturers. This disparity is even more pronounced by engine type: the average difference was 23.7 % for gasoline cars and 18.1 % for diesel.
The WLTP cycle does not simulate extreme conditions or complex everyday situations. It doesn’t account for long stretches at 120 km/h, low temperatures, heavy use of heating, side wind or a vehicle loaded with passengers and luggage. For electric vehicles, an OCU study of 31 brands found that the declared range is between 9 % and 22 % higher than calculated from the homologated consumption and battery capacity. This is because the protocol allows measuring consumption under ideal conditions, at 23 °C, without considering charging losses.
Plug‑in hybrids (PHEV) present the most extreme case. A T&E analysis of 220,000 EU‑registered units in 2024 showed that they emitted an average of 145 g/km CO₂ under real conditions, six times the 24 g/km declared under WLTP. The EU has adjusted the ‘utility factor’ in 2025 and is preparing a second adjustment for 2027 so that the homologated figure better reflects real use, where the battery is often discharged.
| Vehicle type | Real vs WLTP average difference | Source |
|---|---|---|
| Gasoline | 23.7 % higher consumption/emissions | EU Commission |
| Diesel | 18.1 % higher consumption/emissions | EU Commission |
| Electric (Range) | 9‑22 % lower real range | OCU |
| Plug‑in Hybrid (CO₂) | Up to 6× higher real emission | T&E / EU Commission |
Section references: OCU: Autonomía media anunciada de un eléctrico ↗ · RutaMotor: Híbridos enchufables bajo la lupa ↗ · El Motor: Informe Comisión Europea consumo ↗
- Real consumption averages 20 % higher than WLTP.
- Electric range can be 9‑22 % lower than declared.
- PHEVs emit up to six times more CO₂ in reality than lab.
How to Compare Two Cars Using WLTP as a Starting Point
Despite its limitations, WLTP remains the best tool to compare models against each other. If two cars have similar WLTP consumption, their on‑road behaviour is likely comparable as well. However, to make an informed decision you should adjust the figure based on your driving pattern.
If your use is predominantly urban, pay attention to the low‑speed phase of the cycle. Conventional hybrids excel here because at low speed the electric motor and regenerative braking recover energy, making city driving more efficient than combustion cars. In contrast, if you drive many highway kilometres, the electric motor must combine with the thermal engine and regenerative opportunities are lower, so consumption approaches that of a pure thermal car.
For electric vehicles it’s prudent to apply a safety margin. A vehicle that homologates 17 kWh/100 km may jump to 23 kWh/100 km on a constant‑speed highway, reducing real range by more than 20 %. Use the WLTP figure as a base, but multiply by a safety factor (between 1.1 and 1.3) depending on whether your use is urban or highway to estimate real costs.
Section references: Motor.es: Consumo homologado híbridos ↗ · El Confidencial: Mito de la autonomía eléctrica ↗
- Always compare consumption by phase, not just the average.
- Adjust WLTP based on your urban vs highway usage ratio.
- Apply a 10‑30 % safety margin to estimate real costs.
Common Mistakes When Interpreting Official Consumption Figures
The most frequent error is assuming that the WLTP figure is a guaranteed consumption. It’s a laboratory measurement, not a performance promise. Another mistake is ignoring the engine type when comparing. A plug‑in hybrid may have a very low WLTP figure, but if the battery isn’t charged, its real consumption will be much higher than a conventional hybrid or even an efficient thermal car.
It’s also common to overlook the impact of climate control. In winter, heating use and low temperatures significantly affect performance, especially in electric vehicles. The WLTP cycle runs at 23 °C, an ideal temperature that is not replicated in most months of the year in Spain. Finally, ignoring vehicle weight and passenger load can lead to underestimating real consumption, as the cycle assumes a light or minimally loaded vehicle.
Section references: El Confidencial: Mito de la autonomía eléctrica ↗
- Don’t confuse combined average with your specific scenario.
- Don’t assume a PHEV is efficient if the battery isn’t charged.
- Don’t ignore temperature and climate control impact on performance.
Why does my car use more fuel than the technical sheet says?
The technical sheet shows WLTP consumption, a laboratory measurement under ideal conditions. Real consumption is usually about 20 % higher on average due to temperature, traffic, vehicle load and driving style, which are not simulated in the cycle.
Is WLTP more reliable than the old NEDC?
Yes, WLTP is more realistic than NEDC because it includes higher speeds and more dynamic accelerations. However, it remains a laboratory test and does not reflect all road conditions, so it should be used as a comparative reference, not an absolute figure.
How does WLTP affect plug‑in hybrids?
WLTP evaluates PHEVs with the battery both charged and discharged, combining results. In reality many users don’t charge the battery, making real consumption much higher than homologated. The EU is adjusting regulations to better reflect this usage.
Should I trust the declared range of an electric car?
The declared WLTP range is usually 9‑22 % higher than real. For trip planning, it’s advisable to apply a safety margin and consider climatic conditions and climate control use, which are not accounted for in homologation.