Acceleration and top speed: what the figures tell you
What 0–100 km/h and top speed mean, which details appear in the technical data sheet, and how to interpret the figures without reading more into them than the sources support.

Key points
The 0–100 km/h figure states how long a vehicle takes to accelerate from 0 to 100 km/h; the technical data sheet includes a top-speed field. The sources reviewed describe these data but do not establish how they were measured or, by themselves, assess other aspects of the vehicle.
What 0–100 km/h expresses
The 0–100 km/h acceleration figure states how long a vehicle takes to accelerate from 0 to 100 km/h. EuroTaller notes that the figure refers to the specified interval; when reading it, always identify the exact range it covers.
No standardized method or test conditions are specified for the performance figures. Recording the source and whether it provides those details helps preserve the context of the data, but does not by itself establish whether different figures are comparable.
To describe a figure accurately, keep it with its unit and the interval it refers to. For example, a time from 0 to 100 km/h should not be presented as a measurement of acceleration over a different range. If a source does not provide the method or conditions, note that rather than filling in the gaps by inference.
Section references: ¿Sabes interpretar los datos técnicos básicos de tu coche? ↗
- Identify the interval the figure refers to: 0 to 100 km/h.
- Record the source and whether it states the method or conditions; do not infer comparability when those details are absent.
- Keep the unit and interval when quoting the figure; do not apply it to a different speed range.

Top speed in the technical data sheet
DGT documentation identifies “Maximum speed” as a field in the technical specification. Do not assume that a figure in that specification is equivalent to an independent comparative test; check the origin and conditions of any other data you compare it with.
performance figures also do not allow possible differences to be attributed to the transmission, version or other factors.
When cross-checking information, record separately the value shown in the technical data sheet and the value published by each other source. This avoids presenting figures from different origins as if they were the same data point. If the documentation does not explain how the top speed was obtained, the prudent conclusion is simply to state that it appears in the data sheet, without describing it as the result of a specific test.
Section references: Apéndice II: Ficha Técnica (Datos de la tarjeta ITV) ↗
- The technical data sheet identifies a “Maximum speed” field.
- When quoting a figure, state whether it comes from that field or another source.
- Do not describe the figure as the result of an independent measurement if the source does not say so.
How to preserve the context of the figures
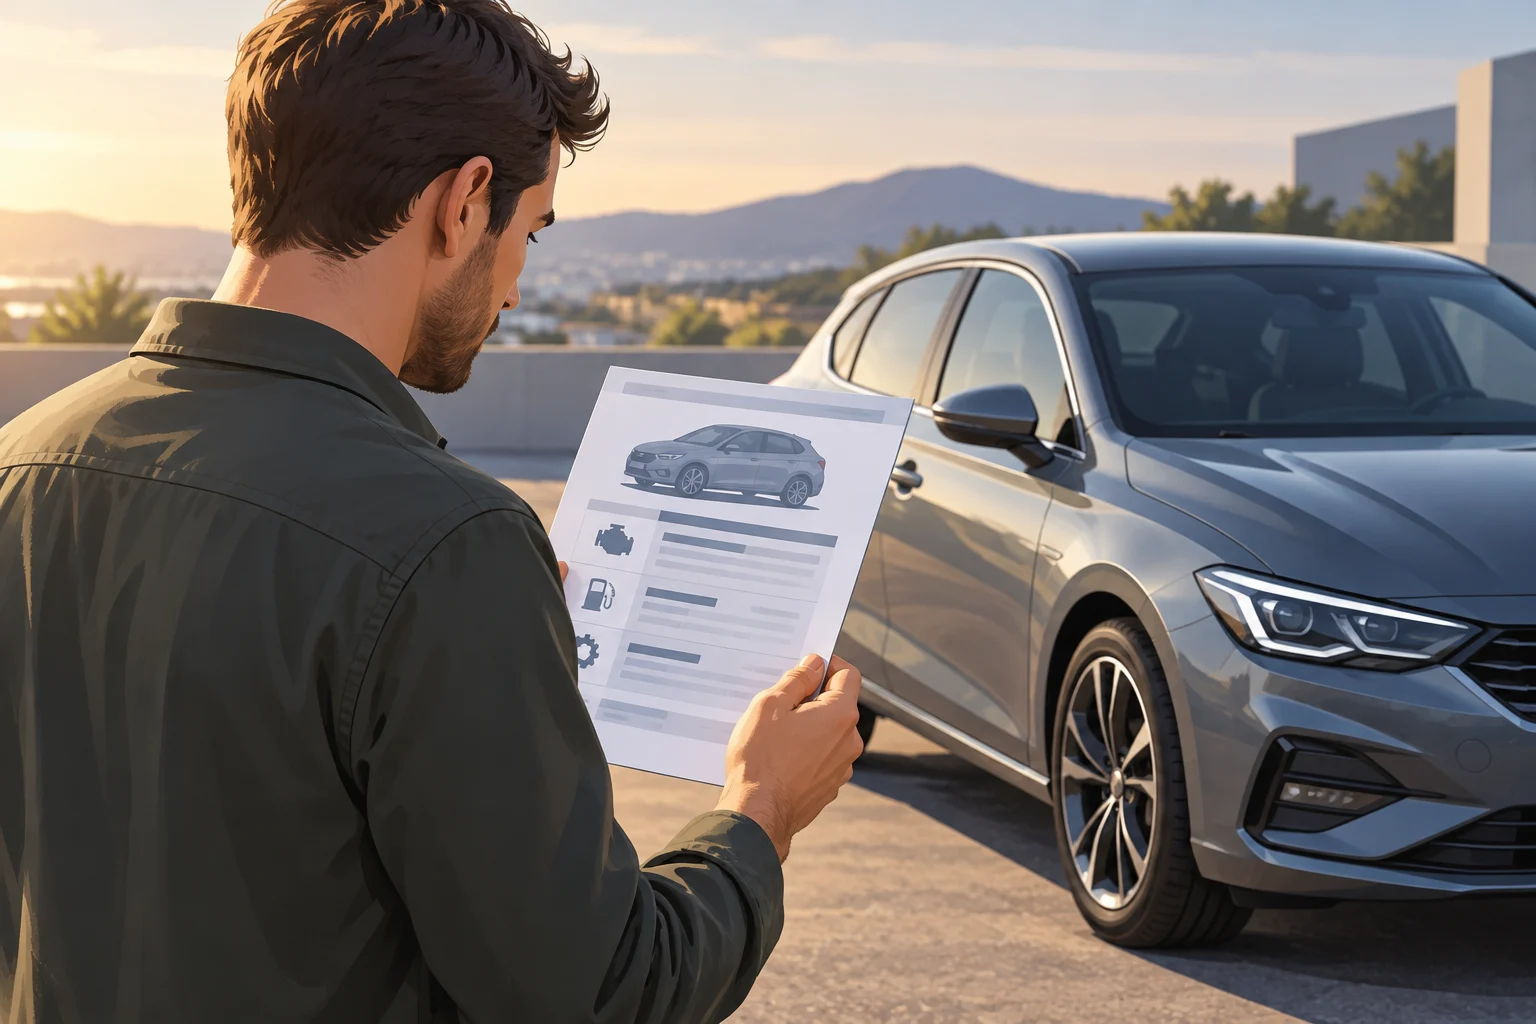
When organising the data, record the value, interval and source. Add the method and conditions only when the source states them, and mark details that are absent as “not specified”. This preserves context; it does not prove that two figures are comparable.
performance figures do not detail test conditions such as load, temperature, gradient or road condition; therefore, they cannot explain differences in terms of these factors.
A reference sheet can list the 0–100 km/h figure separately from top speed and, for each, include the document where it appears and any method or conditions the source explicitly states. Keeping the fields separate makes it possible to check where each figure came from and identify missing information, without making assumptions about the vehicle or test.
Section references: ¿Cómo interpretar los datos técnicos de un coche? ↗ · ¿Sabes interpretar los datos técnicos básicos de tu coche? ↗
- Record the figure, its exact interval and its source.
- Note any stated method and conditions; flag details that are not specified.
- Do not attribute differences to factors that the performance figures do not document.
- Keep 0–100 km/h acceleration and top speed separate, with the source for each.
What these figures allow you to conclude
The 0–100 km/h time describes how long the vehicle takes to accelerate over that interval, and the technical specification includes a “Maximum speed” field. Performance figures alone are not enough to assess safety or ease of everyday use; also consider the vehicle’s other features and its conditions of use.
Interpret each figure according to the source presenting it, and avoid turning it into an overall assessment of the vehicle.
In practice, responsible comparison starts by checking that the figures are the same type of data and that their sources are known. If details about the method, conditions or origin of a figure are missing, state that limitation: the sources reviewed do not resolve it or support conclusions about safety, everyday use or performance in other situations.
Section references: Apéndice II: Ficha Técnica (Datos de la tarjeta ITV) ↗ · ¿Sabes interpretar los datos técnicos básicos de tu coche? ↗
- Distinguish what each figure expresses from conclusions that DGT documentation does not establish.
- Assessing safety or everyday use requires additional evidence.
- If the method or origin of a figure is unknown, state that limitation rather than inferring how it was obtained.
What does a car’s 0–100 km/h figure mean?
It is the time the vehicle takes to accelerate from 0 to 100 km/h.
What does the technical data sheet say about top speed?
DGT documentation identifies a field called “Maximum speed.”
What should you note when looking at acceleration figures?
Record the interval, the source and, if stated, the method and conditions. This preserves context but does not by itself establish that different figures are comparable.
What do these figures allow you to conclude about safety or everyday use?
A performance figure alone is not enough to assess safety or ease of everyday use; also consider the vehicle’s other features and its conditions of use.